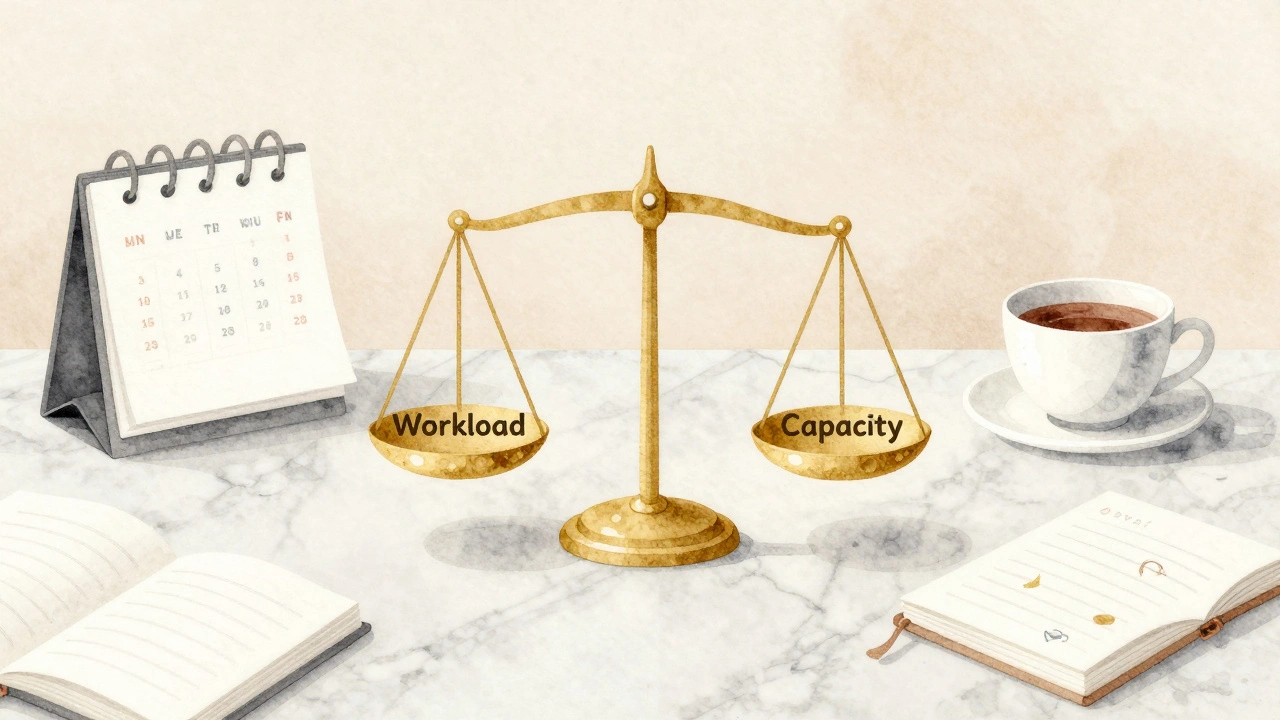
There’s nothing quite like finding out your team is drowning in requests while half your staff sits idle because the schedule wasn’t built right. In a concierge business, the difference between profit and chaos often comes down to one concept: understanding exactly how much work your people can handle without burning out. You aren’t just filling shifts; you are balancing human energy with client expectations. That balance is where Capacity Planning becomes critical.
Many managers mistake utilization for simple attendance. They assume if someone is clocked in, they are producing. But in service roles, especially concierge work, being at a desk doesn’t mean resolving issues. True utilization tracks the ratio of productive work time against total available time. If you ignore this distinction, you end up with a team that looks busy on paper but misses delivery deadlines when pressure spikes.
Understanding Service Team Utilization
Utilization isn’t just about counting hours. It’s about categorizing those hours into billable tasks versus administrative overhead. In our industry, we see a common gap where managers expect 100% utilization. This expectation sets teams up for failure. Humans need breaks, training time, and moments to think before executing complex client requests.
Service Utilization Rate typically measures active work time divided by scheduled availability. For a concierge role, this includes handling inquiries, booking logistics, and problem-solving. Excluded time covers meetings, emails unrelated to immediate tasks, and paid leave. A healthy target often hovers around 75% to 85%. Anything higher usually signals overtime creep and impending fatigue.
When utilization hits 90%, quality slips. Requests get rushed. Errors increase. Clients notice the difference immediately. Conversely, if utilization drops below 65%, you’re paying for unused potential. Finding that sweet spot requires looking at historical data rather than guessing based on gut feeling.
Consider a scenario where your team handles travel bookings during peak season. You have five agents. Each works eight hours. One agent spends four hours fixing a complex itinerary error. Is their utilization 100%? Technically yes, they were working the whole time. Did they help any new clients? No. This highlights why utilization rate must be paired with output metrics to give a true picture of performance.
| Role Type | Ideal Utilization % | Risk at High Levels |
|---|---|---|
| Concierge Agent | 75% - 80% | Response time slows down |
| Client Liaison | 70% - 75% | Communication errors rise |
| Operations Manager | 60% - 65% | Strategic focus is lost |
These targets vary by complexity. Higher skill requirements usually mean lower ideal utilization numbers because problem-solving takes deeper cognitive load than repetitive tasks. You cannot treat a senior consultant the same way you treat an entry-level reservation clerk when calculating your needs.
The Math Behind Available Capacity
To plan effectively, you first need to know your baseline supply. This isn’t just headcount times shift length. You must subtract every predictable block of non-working time. Holidays, planned vacations, sick days, and mandatory training sessions eat into the calendar before a single client request arrives.
Available Capacity represents the maximum hours your team can realistically deliver. A standard calculation starts with total paid hours minus PTO (Paid Time Off) allowances. If you have ten employees taking two weeks of vacation annually, that reduces your yearly capacity significantly. Ignoring this creates artificial shortages during summer months or holiday rushes.
Then factor in shrinkage. Shrinkage includes break time, unpaid lunch, and internal meetings. Some companies estimate this at 15% of scheduled time. Others calculate it precisely based on actual time logs. Accuracy matters here because miscalculating shrinkage by even 5% can leave you understaffed during critical windows.
- Calculate total scheduled hours for the period (e.g., monthly).
- Subtract authorized time off (vacation, sick, holidays).
- Subtract non-billable administrative duties (meetings, training).
- The result is your net available capacity for client work.
When you build your forecast from this net number instead of gross hours, your plans stop relying on hope. You know exactly how many man-hours exist to tackle the incoming volume.
Predicting Demand Accurately
Knowing your capacity is only half the battle. You also need to predict the demand hitting your doors. Historical patterns offer the best starting point. Look at last year’s same period. Did Q4 always spike? Was there a dip after the holidays?
Demand Forecasting relies on analyzing past data to project future workload volumes. Seasonality plays a massive role in concierge services. Travel peaks, corporate events, and local happenings drive request surges. A flat average hides these spikes. You need to map weekly or daily fluctuations rather than relying on monthly averages alone.
External factors change the equation too. Economic shifts might reduce luxury spending, or a sudden event might boost local tourism. Qualitative adjustments matter here. Talk to your sales team. Ask front-line staff what they hear in the pipeline. They often spot trends before the numbers catch up.
If your forecasting model ignores these external signals, you will likely face bottlenecks. Bottlenecks kill morale. When agents see an inbox exploding while others wait, frustration builds. Clear communication about expected volume helps manage expectations internally.
Handling Peaks and Valleys
No business runs at a steady pace forever. You will have rush periods and quiet patches. The goal isn’t to eliminate the valleys but to survive them without cutting jobs. Flexibility is key. Cross-training team members allows you to move resources where they are needed most.
During peak times, you might implement temporary overflow protocols. This could mean bringing in contract workers who understand your specific systems. Or, it could involve shifting responsibilities so experienced staff handle complex cases while juniors take simpler tickets.
Resource Allocation involves matching specific skills to specific demands dynamically. If a client requests a complex medical appointment booking, assigning that to a specialist prevents delay. Generic assignment routes everything to whoever is free next, potentially increasing resolution time.
On the flip side, during quiet weeks, utilize the time for professional development. Instead of forcing work that isn’t there, invest in training. Upskilling the team ensures they are ready when the next surge hits. This turns downtime into investment rather than waste.
Burnout prevention is the ultimate metric here. Sustainable capacity planning respects human limits. Overworking staff to hit short-term targets destroys long-term retention costs. Replacing a trained concierge often costs more than covering an extra shift.

Tools for Tracking and Adjustment
Spreadsheets get messy fast when variables multiply. Dedicated workforce management tools track time, forecast needs, and adjust schedules automatically based on rules you set. They integrate with your ticketing system to show real-time workloads.
However, tools don’t fix bad logic. Garbage in, garbage out. Your input assumptions on average task duration must be accurate. If you tell the system a call takes five minutes but it really takes twenty, the tool will schedule fewer people than you need. Regular audits compare estimated time versus actual time to refine your baselines.
Review meetings shouldn’t just focus on what went wrong. Identify process improvements that reduce handle time. Removing friction from workflows increases effective capacity without hiring new people. Automation for repetitive queries frees humans for high-value interactions.
Finally, keep it transparent. Share the utilization goals with the team. When staff understands the math behind their schedule, they engage more with the solution rather than resisting the constraint. Trust drives compliance better than mandates.
Frequently Asked Questions
What is a healthy utilization rate for service teams?
A healthy range typically falls between 75% and 85%. Going above 90% often leads to burnout and errors, while dropping below 65% indicates underutilization of your budget.
How do I calculate available capacity accurately?
Start with total scheduled hours, then subtract PTO, holidays, sick leave, and administrative meeting time. This net figure represents the actual hours available for client work.
Why does demand forecasting fail sometimes?
It often fails when relying solely on historical averages without accounting for seasonality, market changes, or special events that disrupt normal patterns.
Can cross-training improve capacity planning?
Yes, cross-training allows you to shift staff between roles during peaks and valleys, smoothing out resource gaps without adding headcount.
What happens if utilization is too high?
High utilization risks quality decline, employee burnout, increased turnover, and slower response times for clients, ultimately hurting revenue in the long run.